TL;DR I transformed global buoy data into a soothing visualization.
Background
Lately, I've been interested in exploring open-source datasets and finding ways to visualize raw public data in a way that actually feels engaging to interact with. A lot of public scientific data is incredible in theory, massive in scale, and completely unreadable unless you already know what you're looking for.
While poking around marine and weather feeds, I came across the NOAA National Data Buoy Center (NDBC). Scattered across the Pacific, Atlantic, and Caribbean are floating weather buoys bolted with sensors that measure wave height, swell rhythm, wind gusts, atmospheric pressure, and sea temperature—broadcasting fresh readings via satellite every 10 to 60 minutes. Best of all, all of it is free and open to the public.
The catch? NOAA publishes those transmissions as raw, whitespace-delimited .txt files filled with cryptic column headers (WVHT, DPD, APD, MWD, WTMP) and MM placeholders whenever a sensor drops out in rough seas. If you're a mariner or oceanographer, that table tells a story. For everyone else, it looks like a wall of numbers.
Example of NOAA dataset
Goals
I wanted to see if I could translate those live satellite packets into something tactile, visual, and intuitive without stripping away the underlying science.
Turn dense, open-source ocean telemetry into an engaging interactive visualization
Vibe code beyond standard 2D charts into an isometric 3D canvas (with an optional generative audio layer)
Make unfamiliar marine metrics legible at a glance for non-experts
Design a responsive layout that feels intentional on both desktop and mobile
Process

Understanding & structuring the data
Before jumping into layout or styling, I needed to understand what each buoy actually broadcasts and which variables would translate best into visual form:
Wave Height (WVHT): Significant wave height in meters—the clearest indicator of calm water vs. heavy seas
Dominant & Average Wave Period (DPD / APD): How many seconds pass between wave crests, which separates slow, deep ocean groundswells from short, rapid wind chop
Wave & Wind Direction (MWD / WDIR): Compass angles showing which way swells and surface winds are traveling
Wind Speed & Gusts (WSPD / GST): Surface wind intensity whipping across the water
Water Temperature (WTMP): Sea-surface temperature in Celsius
Even though the goal was to abstract these readings into shapes, motion, and color, I still wanted people to see where the numbers came from. Early on, I decided to keep an expandable { } Raw NOAA Packet drawer in the interface so anyone curious could inspect the real plain-text telemetry rows right alongside the visualization.
Proof of Concept Prototype
To understand the way these data points could translate into a visualization with a buoy and its data.
Visual inspiration
Rather than defaulting to line graphs or a standard map-pin dashboard, I pulled inspiration from tactile dot-matrix graphics, layered isometric diagrams, and editorial latitude/longitude spines. I brought those references into Antigravity to establish the core interaction model first—an interactive 5-plane isometric 8×8 grid paired with a spatial station tuner—before worrying about visual polish.
Vibe coding & UX iterations
Getting a working prototype on screen in Antigravity was fast. Making it genuinely legible took several rounds of UX critique and rethinking my own assumptions.
Pivoting the 5 planes for legibility
In my very first prototype, the 3D stack had five isometric planes labeled 50 · 75 · 100 · 125 · 150, where each plane represented a different weather parameter (one slice for wind gusts, one for surface chop, one for primary swell, one for wave period, and one for thermal rings), plus a switcher that changed what color meant.
On paper, it sounded clever. In practice, it required way too much mental gymnastics—you couldn't look at the stack and tell what the ocean was actually doing.
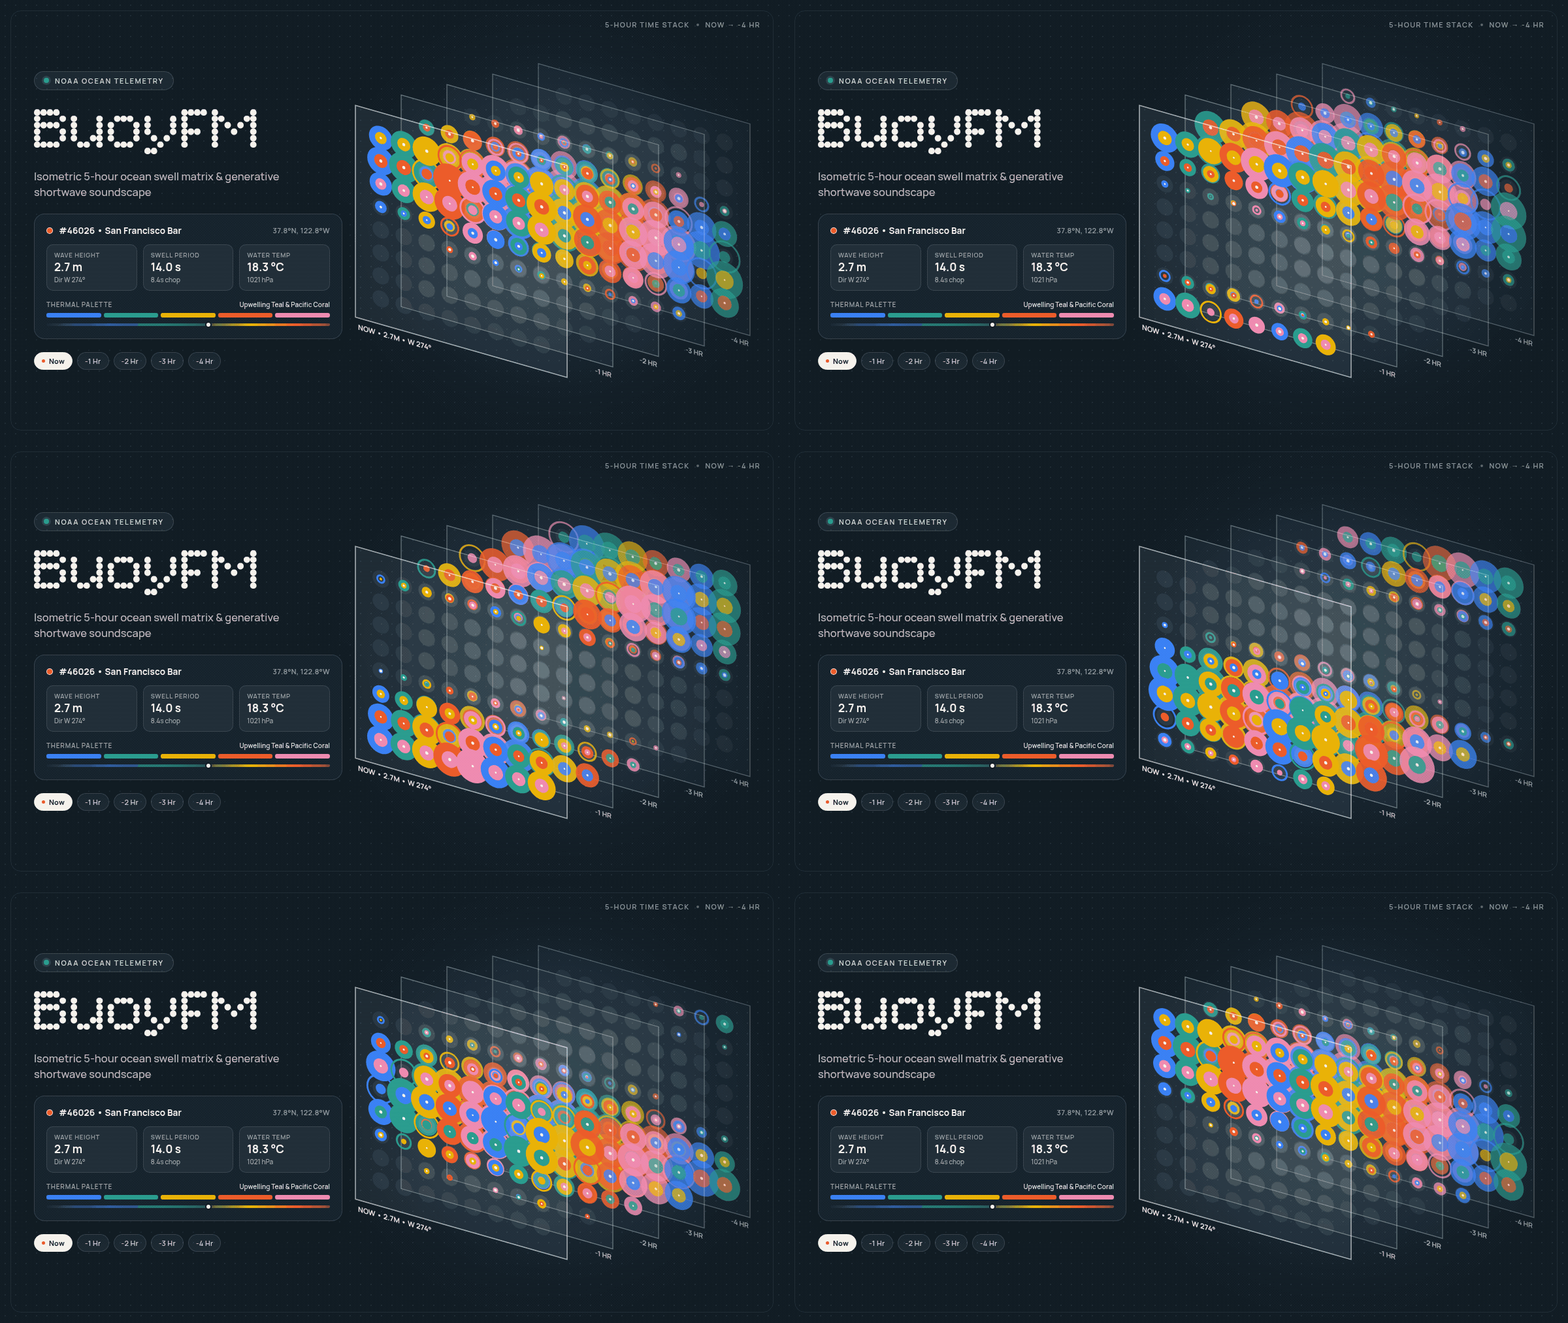
I scrapped the multi-parameter slices and pivoted the stack into a 5-Hour Time-Series (Now → -4 Hr):
Every plane now uses the exact same 4-part visual grammar on an 8×8 grid
Now sits crisply in front, while -1 Hr through -4 Hr step backward with subtle opacity falloff and staggered wave timing
Comparing front-to-back immediately tells a story—you can see whether a swell is building toward the front plane or calming down, solo individual hours, or adjust the Plane Spacing slider to inspect layers without overlap
Making raw telemetry human-readable
Even after unifying the 5-hour stack, encoding four simultaneous ocean variables onto a dot grid isn't self-explanatory on first visit. If a visualization needs a legend, the legend itself has to be effortless to scan. I iterated on two layers of progressive disclosure:
Plain-language Visual Key (?): What started as a text-heavy info sheet evolved into an illustrated legend (a right-side drawer on desktop, full-screen sheet on mobile) with small inline diagrams explaining each cue:
Bubble Size = Wave Height (calm <1m dots up to 4m–6m+ overlapping rings)
Ripple Travel = Wave & Wind Angle (dots stay anchored on the grid while wave crests travel along compass directions)
Hollow Rings vs. Solid Circles = Chop vs. Groundswell (plus pulse tempo tied to wave period)
Color = Water Temperature (alongside a note on NOAA's 10–60 minute public broadcast schedule)
Editorial Onboarding: I added a skippable two-step intro screen to frame the concept up front. On desktop, I widened the layout so all three overview columns sit cleanly with aligned single-line headers; on mobile, I tightened spacing and anchored a sticky bottom bar so the entire intro requires zero scrolling.
Infographic for data variables
Explaining the time planes
Evolving the visual style & typography
The earliest build used a warm archival-paper background (#f0ebe1) with system monospace text and an olive-gold latitude panel. While I liked the print-inspired feel, switching the default theme to thermal dark mode (while keeping a light-mode toggle) made the overlapping bubbles and depth falloff pop like a glowing marine radar at night.
From there, I refined the visual details to tie the interface back to the data:
Temperature-driven palettes: Both the dot-matrix colors and the dark background tint shift automatically based on live water temperature—moving from icy navy in Alaska (~6°C) through teal (~18°C) to warm coral and burgundy in the Caribbean (28°C+).
Typography pairing: I introduced Bitcount Prop Single in a light weight (300) for the BuoyFM wordmark and onboarding headers to echo classic dot-matrix radio receivers, paired with Manrope across the HUD cards, selectors, and legend so dense numbers stay crisp at small sizes.
Tactile canvas details: Beyond orbiting the 3D stack, tapping directly on any plane triggers an expanding wave ripple across the dots (and a soft harmonic chime if audio is unmuted) so the grid feels alive under your cursor or thumb.
Designing separately for desktop and mobile
A trap I often notice in AI-generated data apps is trying to cram a desktop sidebar onto a phone screen. Because BuoyFM is centered around an interactive 3D canvas, the surrounding chrome needed different choreography on each viewport:
Desktop: I anchored the buoy selector in a collapsible left sidebar so toggling Hide / Show never causes the header button to jump around, and offset the 3D canvas center to the right so the left panel never collides with the isometric stack. Time-plane chips and the Plane Spacing slider sit together in a compact pill at the bottom.
Mobile: I moved all primary controls into a thumb-friendly sticky bottom dock. Tapping the active station opens a scrollable buoy drawer (which auto-closes on selection), while keeping a 4-column telemetry strip (Wave Height, Swell / Chop, Wind / Gust, Water Temp), time-plane pills, and spacing slider right below the canvas—paired with two-finger pinch-to-zoom and a zoom reset pill.
Desktop version
Mobile version
Launching & Debugging
Fetching live .txt feeds without breaking the browser
Connecting directly to NOAA's real-time .txt URLs from client-side JavaScript quickly hits CORS restrictions—and even once fetched, real ocean telemetry is delightfully messy. Sensors go offline mid-storm, rows report MM for missing values, and different buoys update at different minute intervals.
Working in Antigravity, I connected the repo to Vercel and built a lightweight serverless proxy (/api/buoy) with edge caching:
Parses the latest 60 rows of NOAA's raw .txt packet and buckets readings into clean hourly snapshots (Now through -4 Hr)
Fills in missing wave spectra when an individual buoy sensor reports MM
Falls back to embedded station snapshots if a network request ever fails offline
Final Result
Learnings
Kill clever ideas that hurt comprehension: My first 5-parameter stack sounded smart on paper and completely failed a 5-second glance test. Locking all 5 planes into one shared visual grammar across time (Now → -4 Hr) instantly made the data readable.
Prototype with real, messy data early: Live ocean sensors drop out (MM), update asynchronously, and leave gaps. Designing around real feeds forces you to solve edge cases and fallback states that clean Figma mocks completely hide.
Progressive disclosure makes complex UI approachable: Unfamiliar visualizations don't need to be dumbed down—they need an on-ramp. Pairing a zero-scroll intro with an on-demand Visual Key lets curious users explore first and decode at their own pace.
Responsive design isn't shrinking desktop onto mobile: A collapsible left sidebar on desktop and a thumb-zone bottom dock on mobile solved two completely different ergonomic problems around the exact same 3D canvas.
AI accelerates execution, not UX taste: Antigravity made it fast to wire up 3D canvas physics and serverless APIs, which meant my real job was continuous UX critique—spotting visual noise, simplifying hierarchy, and knowing what to cut.
Next steps
Historical storm playback: Scrubbing back through notable ocean events (like winter monster swells at Nazaré or offshore hurricanes)
Shareable station links: Deep-linking directly to a specific buoy and soloed hour plane
Mini globe locator: Pairing the eastward longitude list with a minimal spatial map indicator
Buoy cam: Displaying the most recent photos from each buoy
